Talk to your data.
It never leaves your browser.
Upload a spreadsheet, ask a question in plain English, and TalkLytx works out the answer right in your browser — then explains it clearly and shows you exactly how it got there.
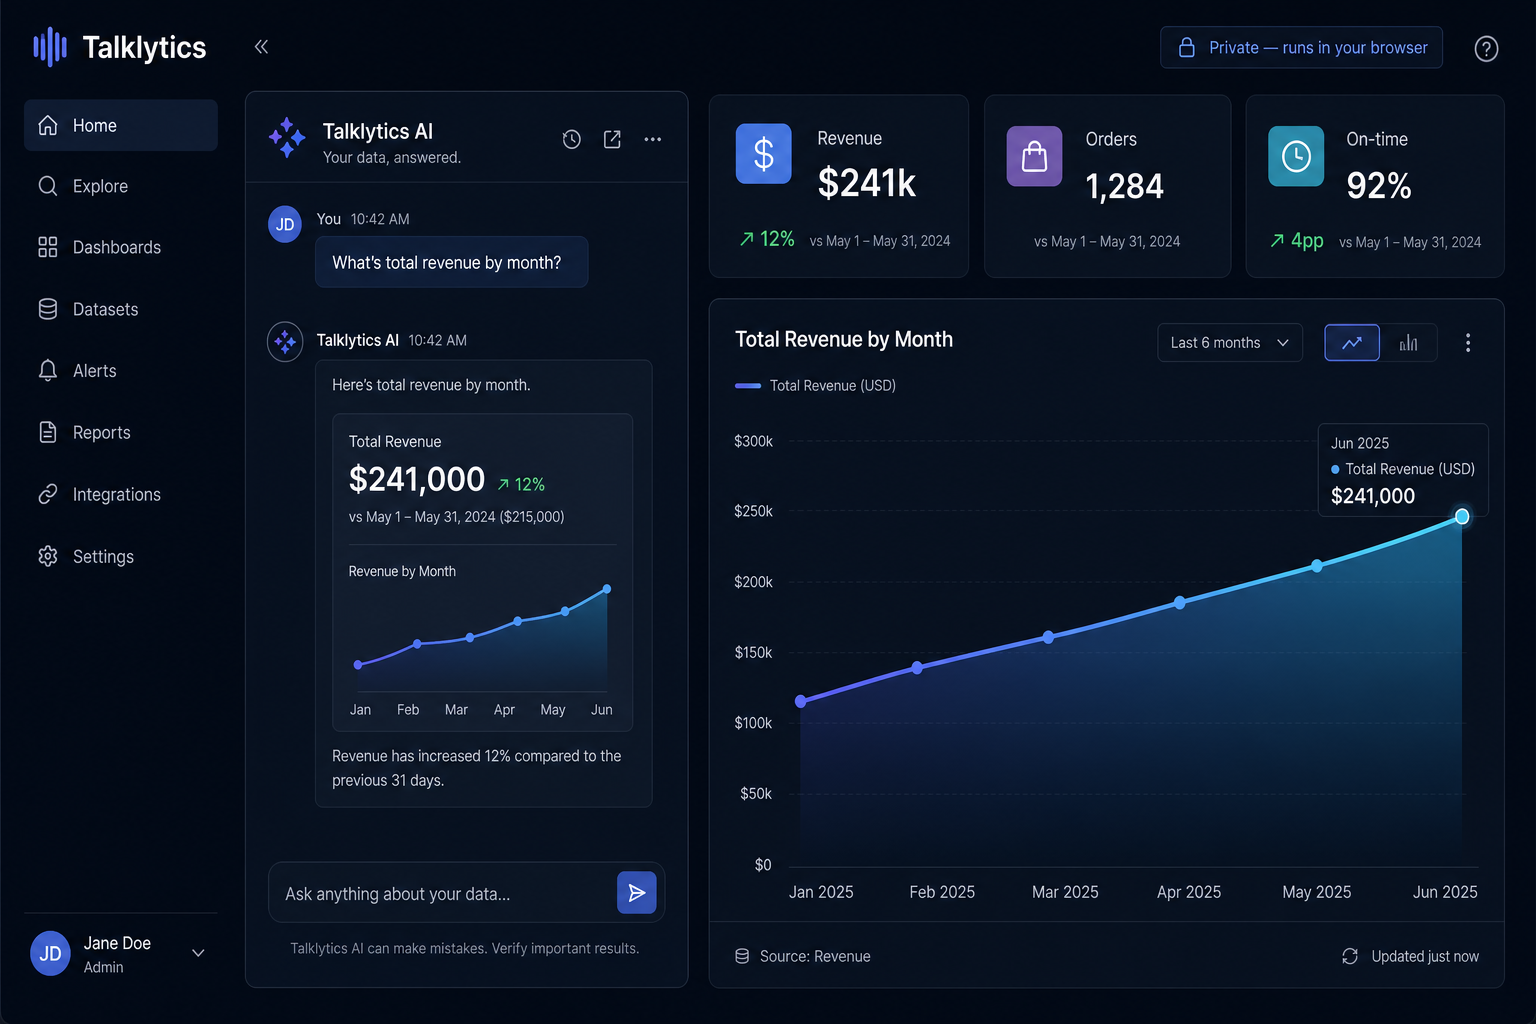
From file to first charted insight
Your data stays in your browser
Files ever sent to our servers
Records handled right on your device
Why TalkLytx
Enterprise-grade analytics, without the enterprise tax
Three advantages most tools can't easily match — because they're built into TalkLytx from the ground up, not bolted on.
Private by design
Your data is analyzed right inside your browser. The AI only ever sees your question — never your actual data.
Lightning fast, everywhere
Built to feel instant from anywhere in the world, with answers that stream onto your screen the moment they're ready.
A free plan nobody can match
Because everything runs right in your browser, we can give away unlimited analysis where others charge for every single question.
How it works
From a raw file to a trustworthy insight in three steps
Drop a file or paste a link
Bring a spreadsheet or a link to your data. TalkLytx instantly understands it and suggests smart questions to get you started.
Ask in plain English
Just type your question the way you'd ask a colleague. TalkLytx figures out exactly what to calculate and double-checks itself before answering.
Get a charted, explainable answer
Get an instant chart, the key numbers, and a clear written explanation — and you can always see exactly how the answer was reached.
Private by design
Your data never leaves your browser
Most tools send your data off to their servers to answer a question. TalkLytx doesn't: everything runs right inside your browser, and the AI only ever sees your question — never your actual data. It's the most private way to analyze sensitive information.
- Your data is never sent to any AI
- You stay in full control of your information
- Ready for privacy-conscious teams

Trust through transparency
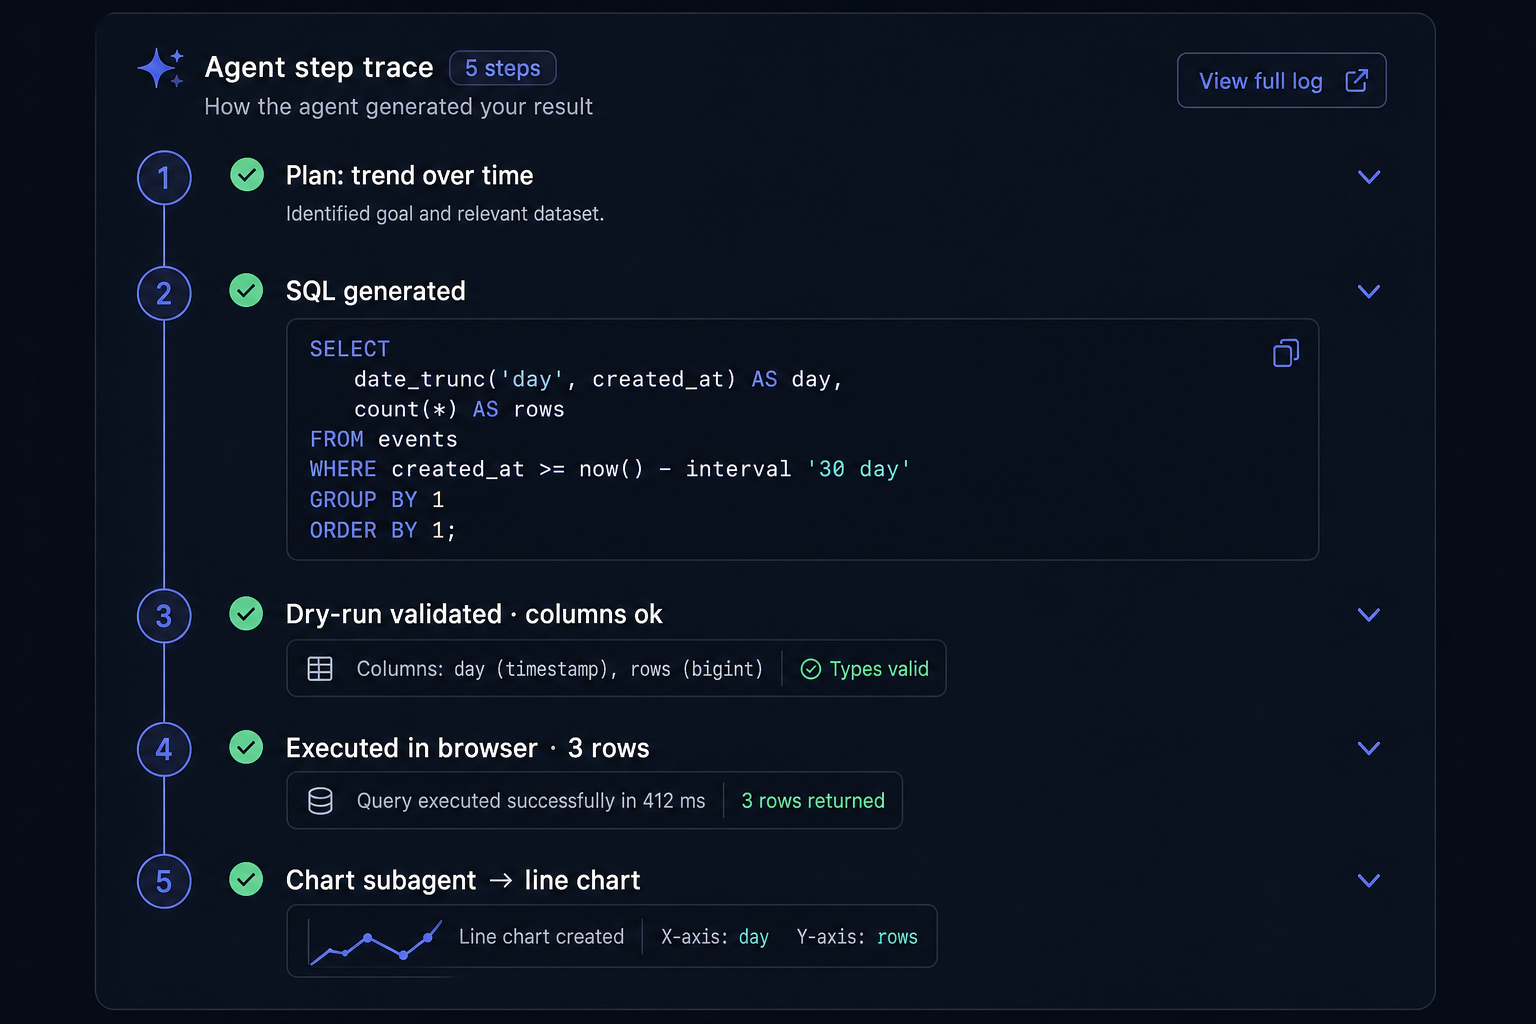
Every answer shows its work
TalkLytx does the math itself and shows every step it took to get there — the plan it followed, the checks it ran, and how it built the chart — so you can trust and defend every number, not just read it.
- See every step behind an answer
- Built-in accuracy checks
- Clear sourcing for every number
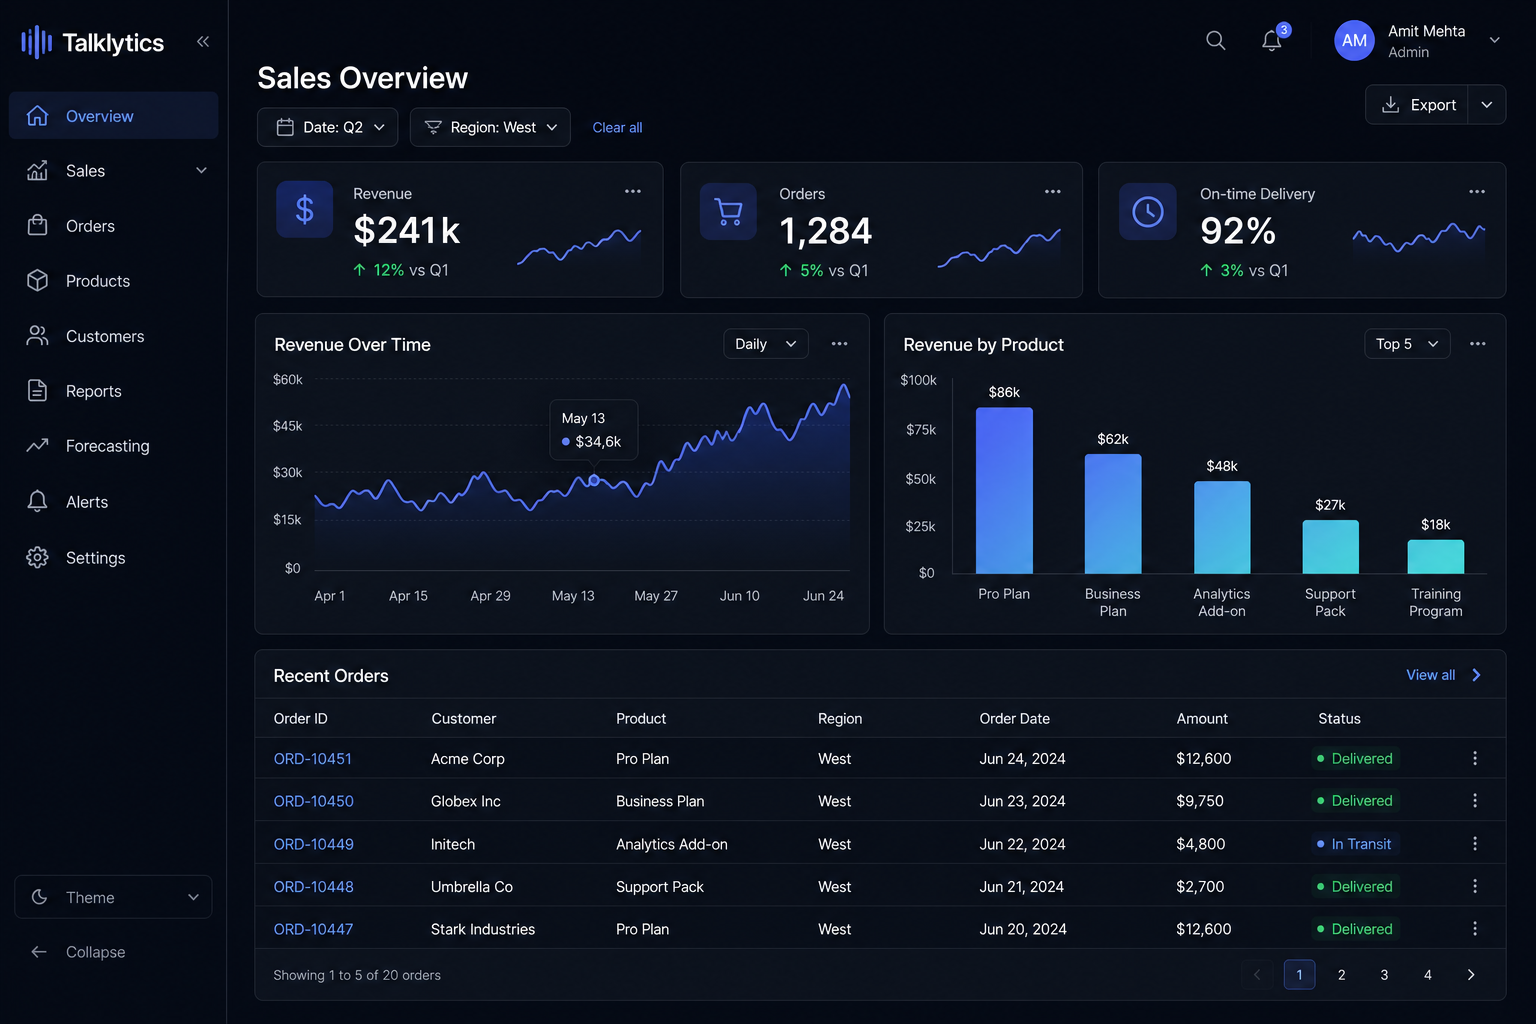
Live, interactive dashboards
Dashboards that stay fresh
Pin your key numbers and charts to dashboards that always show your latest data. Click any chart to filter everything at once, drill into the details, and ask follow-up questions on any card.
- Track your goals at a glance
- Click to filter and drill in
- Export interactive reports in a click
The platform
Everything you need to self-serve with confidence
One seamless experience powers chat, Query Lab, the spreadsheet, and dashboards — so everything stays consistent and connected.
Understands your data
TalkLytx learns what your columns mean and the metrics you care about, so answers are accurate from your very first question.
Beautiful charts, automatically
Every answer gets the right chart type, formatting, and labels — no fiddling required.
See how it works
Open any answer to follow each step it took to reach the result — full transparency, on demand.
Live, interactive dashboards
Pin any answer. Click a bar to filter every card. Each refresh pulls your latest data — never stale snapshots.
Query Lab
Combine and explore all of your data sets together in one place, with AI helping you dig deeper.
Privacy controls & permissions
Decide who can see what, keep a full activity history, and stay in control — the AI always respects each person's permissions.
Pricing
Start free. Scale when you're ready.
A genuinely generous free plan, then simple options that unlock teams, controls, and scale.
Free
For individuals & exploration
- Unlimited file analysis
- See how every answer works
- Private by design
Starter
For small teams
- Teams & sharing
- Higher AI credits
- Export everywhere
Essential
For growing teams
- Advanced security & activity logs
- Scheduled refreshes
- Connect your own tools
Enterprise
For larger organizations
- Single sign-on & data residency
- Unlimited everything
- Priority support
Compare every feature on the pricing page.
Your data has answers.
Ask it anything.
Drag in a file and get a charted, explainable answer in under a minute — free, private, and lightning fast.